
Speedometer
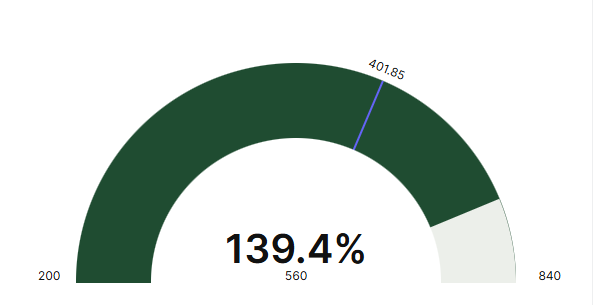
The Speedometer block displays a gauge-style visual that tracks a current value against a defined range and goal, making it easy to monitor progress toward a target at a glance.
For instructions on how to add a block to your app, see the Blocks page.
Capabilities
- Display a calculated value as the current reading on the speedometer
- Set a minimum and maximum value to define the gauge range
- Define a goal value to mark the target on the gauge
- Apply field filters to each value independently
- Toggle style options including title visibility, opposite color progress, and background
Use cases and examples
Use the Speedometer block when you want to:
- Track how close a metric (such as total revenue or average payment) is to a goal
- Visualize KPIs in dashboards with a clear progress indicator
- Compare current performance against a minimum, maximum, or target value
- Give app users an at-a-glance status of a numeric goal without showing a full table
How to configure
Step 1
Add the block: Inside your app page in edit mode, add a Speedometer block. The edit panel will open on the right side.
Step 2
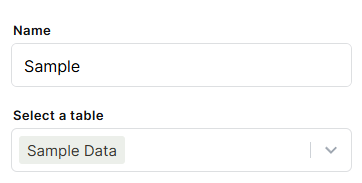
Set the name: In the Name field, enter a label for this block. This name can be displayed as a title on the block depending on your style settings.
Step 3
Select a table: Use the Select a table dropdown to choose which table the block will pull data from.
Step 4
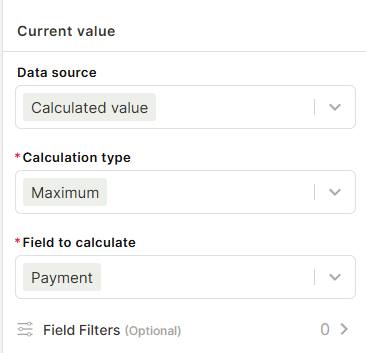
Configure the Current value: This is the main value displayed on the speedometer needle.
- Data source: Choose Calculated value to aggregate data from the selected table, or Fixed value to enter a static number.
- Calculation type: Select how the value should be calculated — options include Sum, Average, Count, Maximum, and Minimum.
- Field to calculate: Choose the numeric field from the table to apply the calculation to.
- Field Filters (Optional): Add filters to restrict which records are included in the calculation.
Step 5
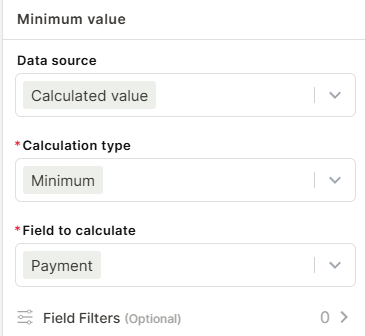
Configure the Minimum value: This sets the starting point of the gauge range.
- Configure Data source, Calculation type, and Field to calculate the same way as the Current value.
- Add Field Filters if needed.
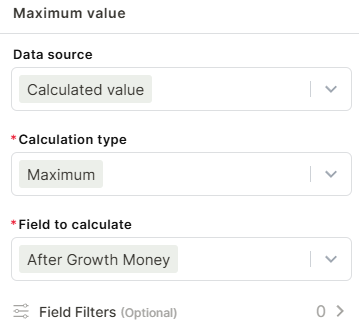
Step 6
Configure the Maximum value: This sets the upper limit of the gauge range.
- Configure Data source, Calculation type, and Field to calculate the same way as the Current value.
- Add Field Filters if needed.
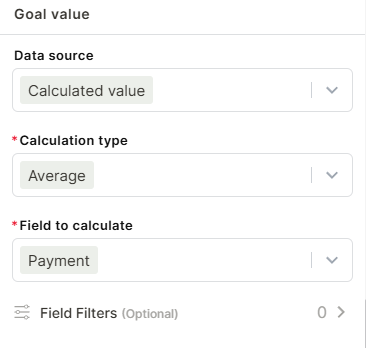
Step 7
Configure the Goal value: This marks a target line on the gauge.
- Configure Data source, Calculation type, and Field to calculate the same way as the Current value.
- Add Field Filters if needed.
Step 8
Apply filters (Optional): Use the Filters option to restrict which records are considered across all value calculations globally.
Step 9
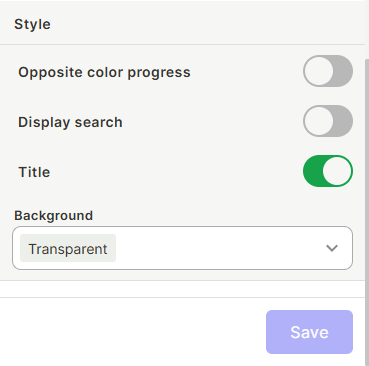
Configure the style:
- Opposite color progress: When enabled, the filled portion of the gauge changes to a contrasting color to indicate progress direction.
- Display search: Toggle on to show a search field on the block.
- Title: Toggle on to display the block name as a visible title. Enabled by default.
- Background: Choose a background color for the block. Defaults to Transparent.
Step 10
Save: Click Save to apply the configuration.
Keep in mind
- Each value (Current, Minimum, Maximum, Goal) is configured independently — they can use different calculation types, fields, and filters.
- The Speedometer block does not display individual records; it only shows aggregated calculated values.
- If no Minimum or Maximum value is configured, the gauge range may not render correctly.
- The Goal value does not trigger any alerts or automations — it is purely visual.
- Fixed values are static and will not update automatically based on table data.
FAQ
1 — Can I use different fields for the current value and the goal value?
Yes. Each value section (Current, Minimum, Maximum, Goal) has its own Field to calculate selector, so they can reference different fields from the same table.
2 — Can I use a fixed number instead of a calculated value?
Yes. In any value section, change the Data source from Calculated value to Fixed value and enter the number directly.
3 — Does the Goal value send an alert when reached?
No. The Goal value is a visual marker on the gauge only. To trigger actions when a value is reached, you would need to configure an automation separately.
4 — Can I filter the data used for just one of the values?
Yes. Each value section has its own optional Field Filters, so you can apply different filtering logic to the Current value, Minimum, Maximum, and Goal independently.
5 — What happens if the current value exceeds the maximum?
The needle will go beyond the gauge boundary visually. It is recommended to set a Maximum value that accounts for the realistic upper limit of your data.
Updated 3 months ago