
Complex Indicator
The Complex Indicator block displays a calculated metric by combining two independent data sources (X and Y) using a mathematical operation. It is designed for dashboards where a single number must reflect a relationship between two values — such as a sum, a difference, a ratio, or a share of total.
This page covers only the Complex Indicator block. For instructions on how to access blocks and add one to your page, see the Blocks page.

Capabilities
- Combine two data sources using four mathematical operations: sum, subtraction, ratio, and percentage of total
- Use variable values (from a table field) or fixed values as each data source
- Apply filters independently to each data source
- Configure labels, number formatting, and visual style
- Choose between Classic and Custom display modes
Use cases and examples
- Showing the ratio of completed tasks to total tasks across a project
- Calculating the percentage of revenue from one product category out of total revenue
- Displaying the net difference between incoming and outgoing payments
- Showing how much of a budget has been consumed (spent / total budget)
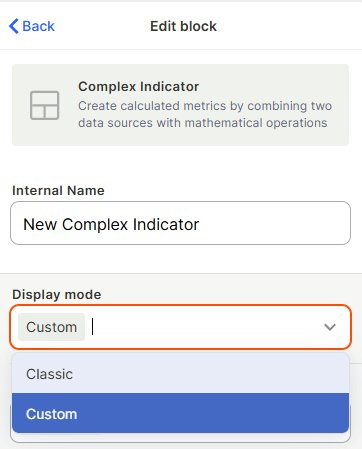
Display mode
The Display mode dropdown controls the visual layout of the block. Jestor has 2 display mode options:
- Classic
- Custom
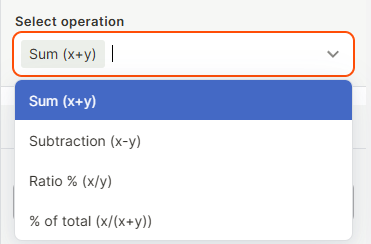
Select operation
Defines the mathematical relationship between data source X and data source Y.
| Operation | Formula | Description |
|---|---|---|
| Sum | x + y | Adds both values |
| Subtraction | x - y | Subtracts Y from X |
| Ratio % | x / y | Expresses X as a percentage of Y |
| % of total | x / (x + y) | Expresses X as a share of the combined total |
Data sources
The block has two independent data sources: X and Y. Each one is configured with the same set of fields.
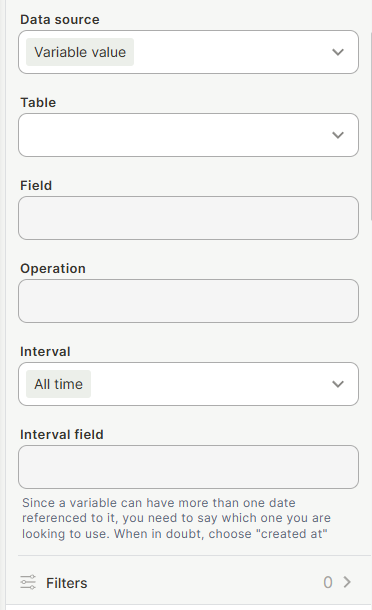
Data source — choose between:
- Variable value — pulls a calculated value from a table field
- Fixed value — uses a manually entered constant number
When Variable value is selected, configure the following:
Table — the table the data will be pulled from.
Field — the specific field to use as the data source.
Operation — the aggregation to apply to the field values (e.g., count, sum, average).
Interval — the time window for filtering records. Defaults to All time.
Interval field — the date field used to apply the interval filter. Since a variable can have more than one date referenced to it, you need to specify which one to use. When in doubt, choose created at.
Filters — optional conditions to narrow down which records are included in the calculation. Each data source has its own independent filter set.
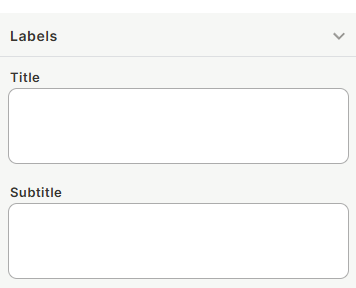
Labels
Title — the main label displayed on the block.
Subtitle — a secondary label shown below the title.
Number formatting
Format — select a format (number, currency, percentage or abbreviated)
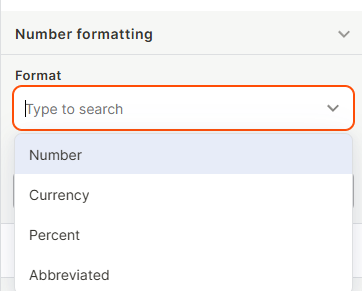
Decimal places — set how many decimal places are shown in the result.
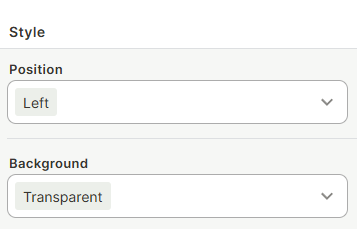
Style
Available when Display mode is set to Custom.
Position — controls the alignment of the content within the block (e.g., Left).
Background — sets the block background color. Defaults to Transparent.
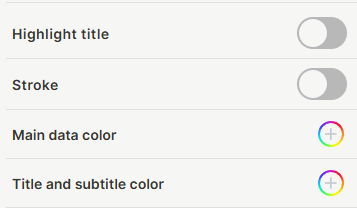
Highlight title — toggle to visually emphasize the title.
Stroke — toggle to add a border around the block.
Main data color — sets the color of the calculated value displayed.
Title and subtitle color — sets the color for the label text.
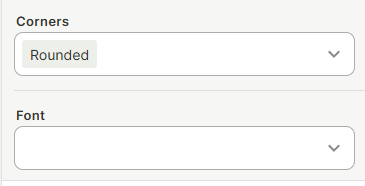
Corners — controls the border radius of the block (e.g., Rounded).
Font — sets the font used across the block.
Keep in mind
- Filters applied to Data source X do not affect Data source Y, and vice versa
- The Interval field setting only appears when Variable value is selected
FAQ
1- What is the difference between "Ratio %" and "% of total"?
Ratio % calculates x divided by y, expressing X as a percentage of Y alone. % of total calculates x divided by (x + y), expressing X as a share of the combined sum of both values.
2- Can I use a fixed number as one of the data sources?
Yes. When you select Fixed value as the data source for X or Y, you enter a constant number manually. This is useful when you want to compare a variable metric against a known target or threshold.
3- Do the filters on X and Y affect each other?
No. Each data source has its own independent filter set. Filters on X apply only to X, and filters on Y apply only to Y.
4- What happens if the Y value is zero when using Ratio % or % of total?
If Y equals zero, the division will result in an undefined or infinite value. The block may display an error or no result in that case — avoid configurations where Y can be zero when using division-based operations.
5- Can I display the result as a currency or percentage?
Yes. Use the Number formatting section to set the format and the number of decimal places shown.
Updated 4 months ago